EVA Scope: Observability for Large-Scale CCTV AI Operations

In large-scale CCTV AI operations, the stability and efficiency of EVA cannot be assessed with a single metric. When dozens of EVAs and hundreds or thousands of cameras are in operation, each frame passes through multiple processing stages inside the App after entering from a camera. This may be manageable when the number of cameras or EVAs is small, but as the operation grows, it becomes increasingly difficult to verify that every frame is following its intended path.
What matters is not simply whether every frame was processed. Operators also need to understand which processing stages are consuming resources, where resources are sitting idle, and whether processing is concentrated on particular cameras or Connections.
EVA Scope observes the end-to-end processing flow of the AI pipeline using Frame Journey data generated by EVA. It provides a comprehensive view of bottlenecks, latency, idle time, and processing imbalance, giving operators the evidence they need to determine how EVA can operate more reliably and efficiently within a limited operating environment.
This article introduces the architecture and key capabilities of EVA Scope, designed to observe frame-processing status in large-scale CCTV AI operations.
1. EVA Scope at a Glance
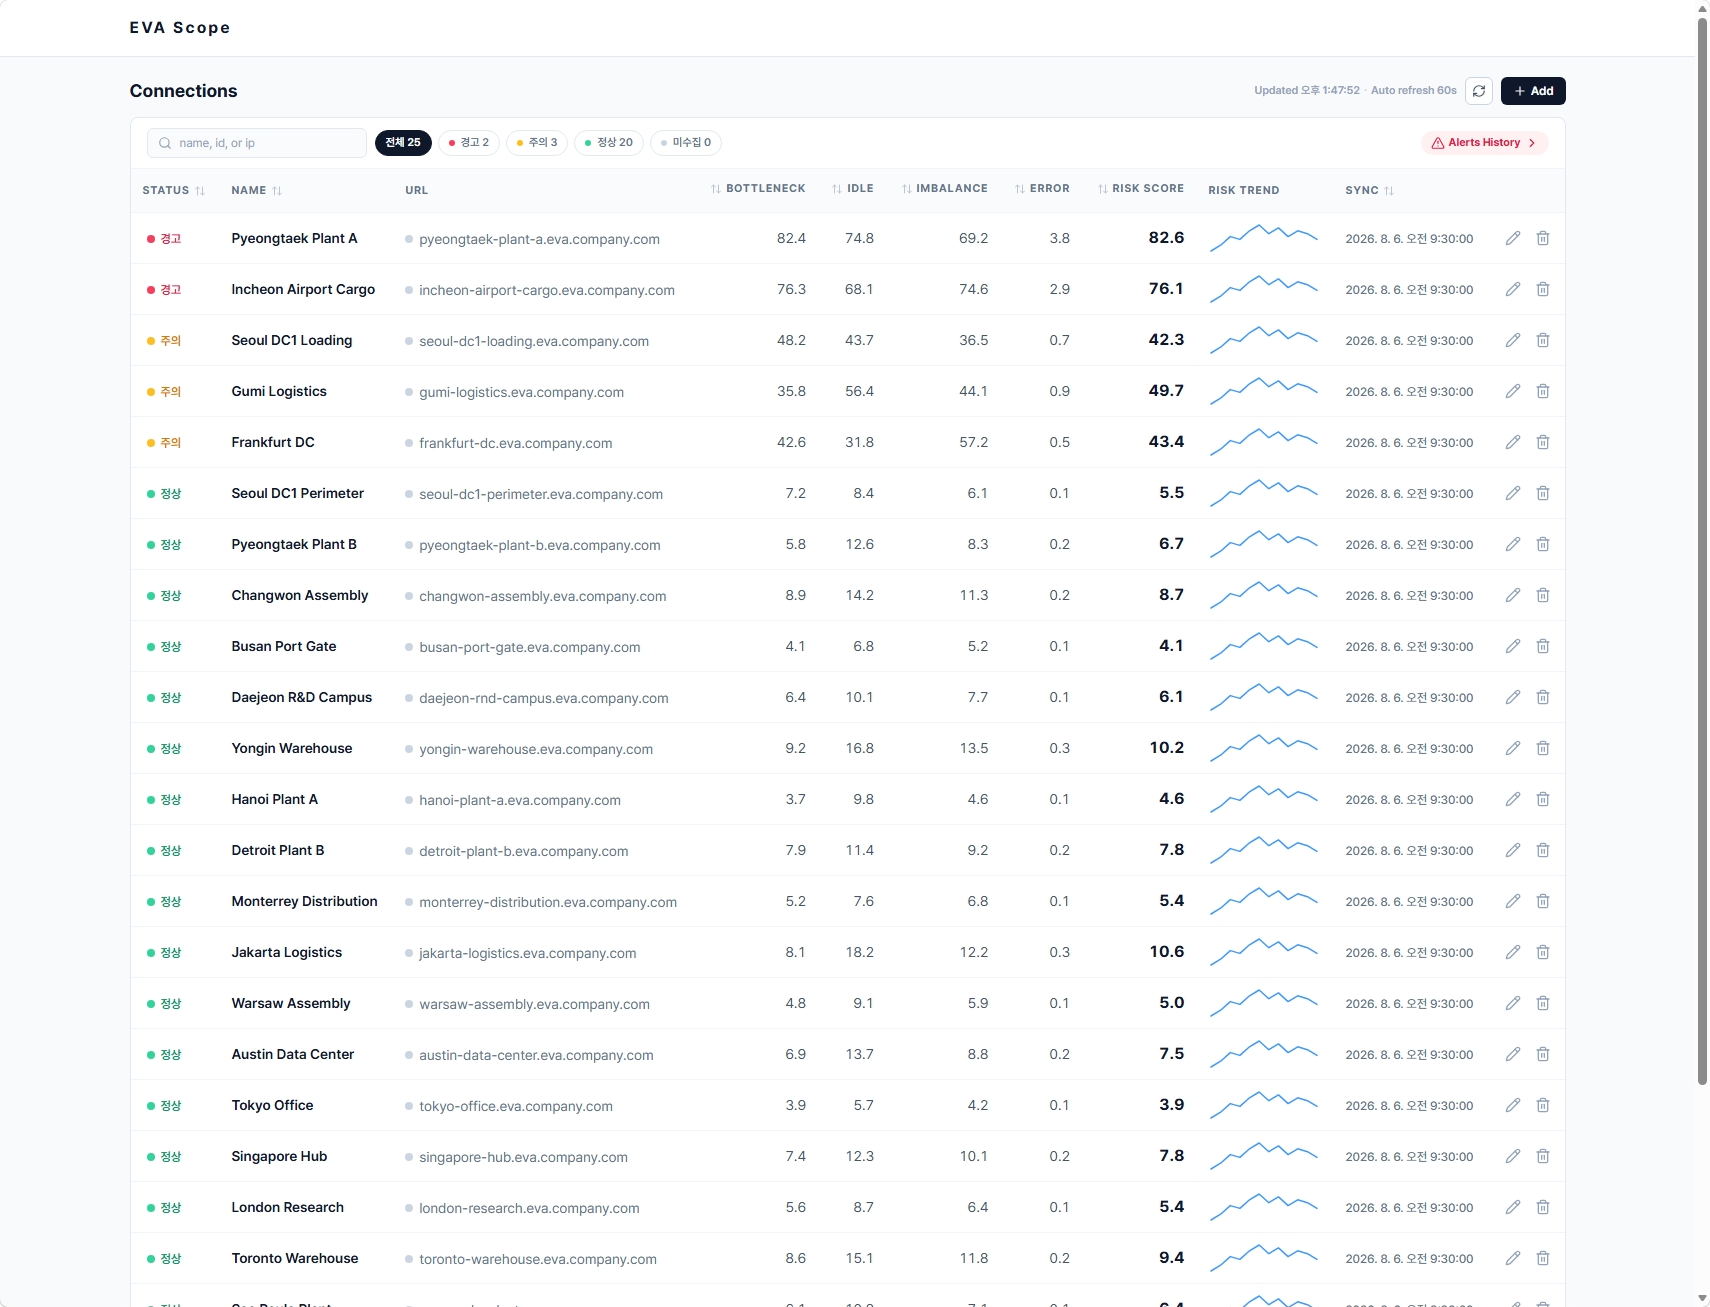
View the status and Risk Score of numerous Connections on a single screen and prioritize the ones that need attention.
Connections List provides the following information for each Connection:
- Normal, caution, and warning status
- Latest Risk Score
- Bottleneck, Idle, Imbalance, and Error indexes
- Recent hourly status trends
- Total frame throughput
- Latest data collection status
- EVA App connection status
- Number of active Alerts
Operators do not need to inspect every Connection in sequence. They can start with the Connections that have the highest risk, check when the status began to change, and then move to the detailed analysis screen.
2. Signal-to-Insight Flow
The core of EVA Scope is not simply displaying a large amount of data. It identifies signals that affect processing efficiency in a large volume of frame data and connects them to analysis at the Connection, camera, processing-stage, and individual-frame levels.
Connections List
The first step is to review the list and status of all Connections, or EVA Apps. EVA Scope explains the factors that affect processing efficiency through four detailed indexes and sets Connection-level priorities with the Risk Score.
Operators can answer questions such as:
- Which Connection has the highest Risk Score?
- Is recent processing efficiency improving or deteriorating?
- Did throughput or latency change during a particular time period?
- Is data collection stable for a particular Connection?
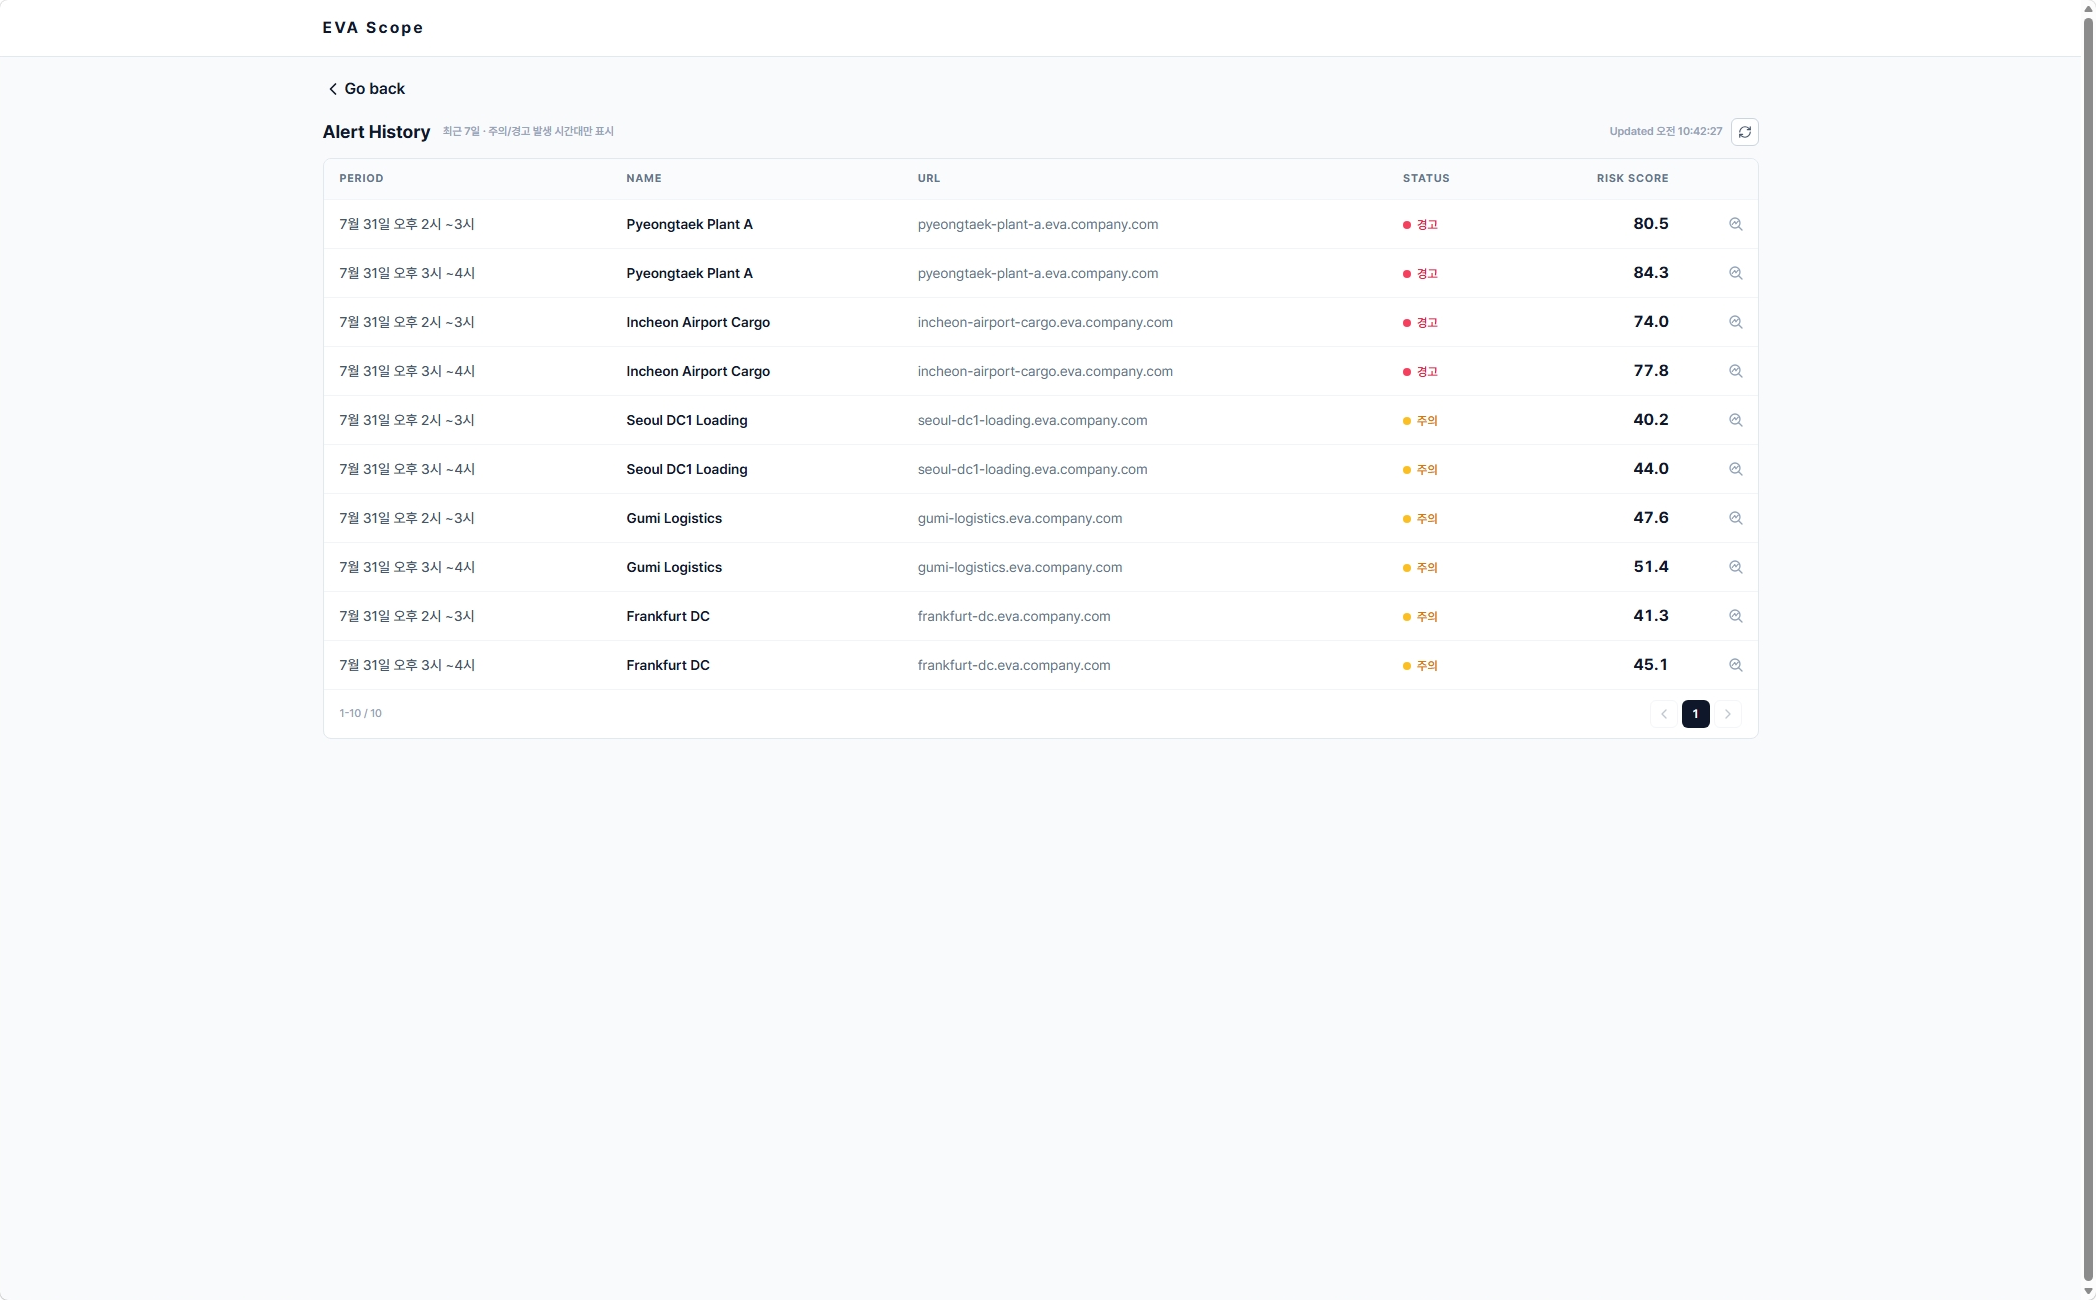
Alert History
When a key metric moves outside its configured threshold or the data collection status requires additional attention, the event is recorded in Alert History. Alert History displays the time period, Connection, status, and Risk Score associated with the problem.
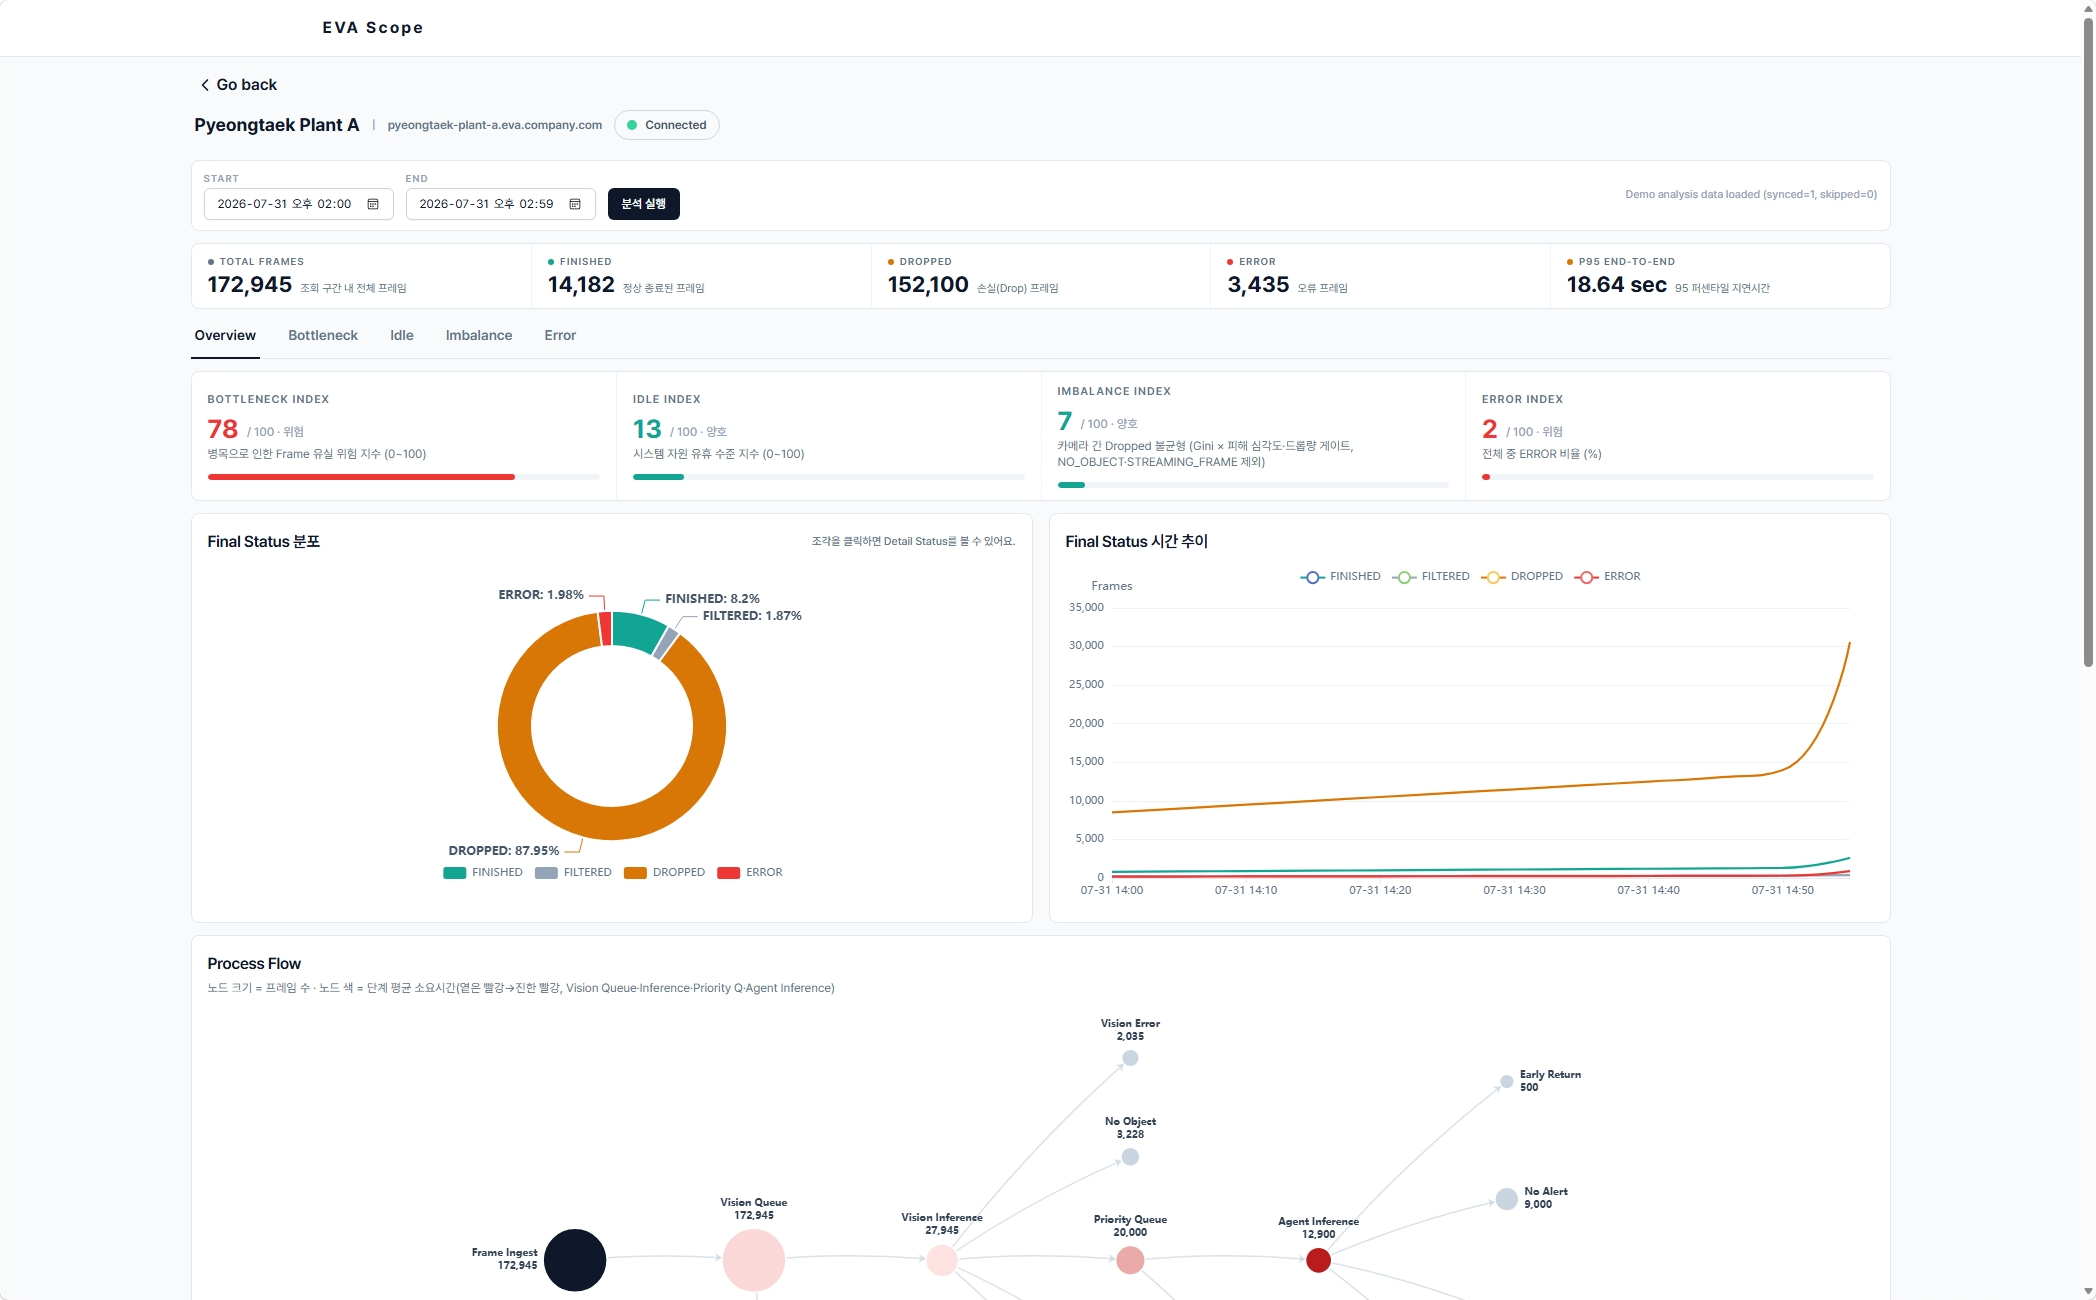
Hourly Overview
Select the Connection where the problem occurred. By setting a start and end time, operators can analyze the Image Frames that entered during that period. They can review the frames’ end states and status trends, processing times, and changes in key metrics to identify the problem. Historical periods can also be analyzed within the seven-day retention window.
Index Analysis
EVA Scope provides four indexes that make up processing efficiency. Because it shows changes in each index together with its detailed components, operators can identify the factors behind a high metric rather than simply observing that the metric is high.
- Bottleneck Index: Processing delays and Queue waiting
- Idle Index: Idle levels in the Vision, Agent, and frame-ingestion stages
- Imbalance Index: Processing imbalance across cameras
- Error Index: Ratio of erroneous frames
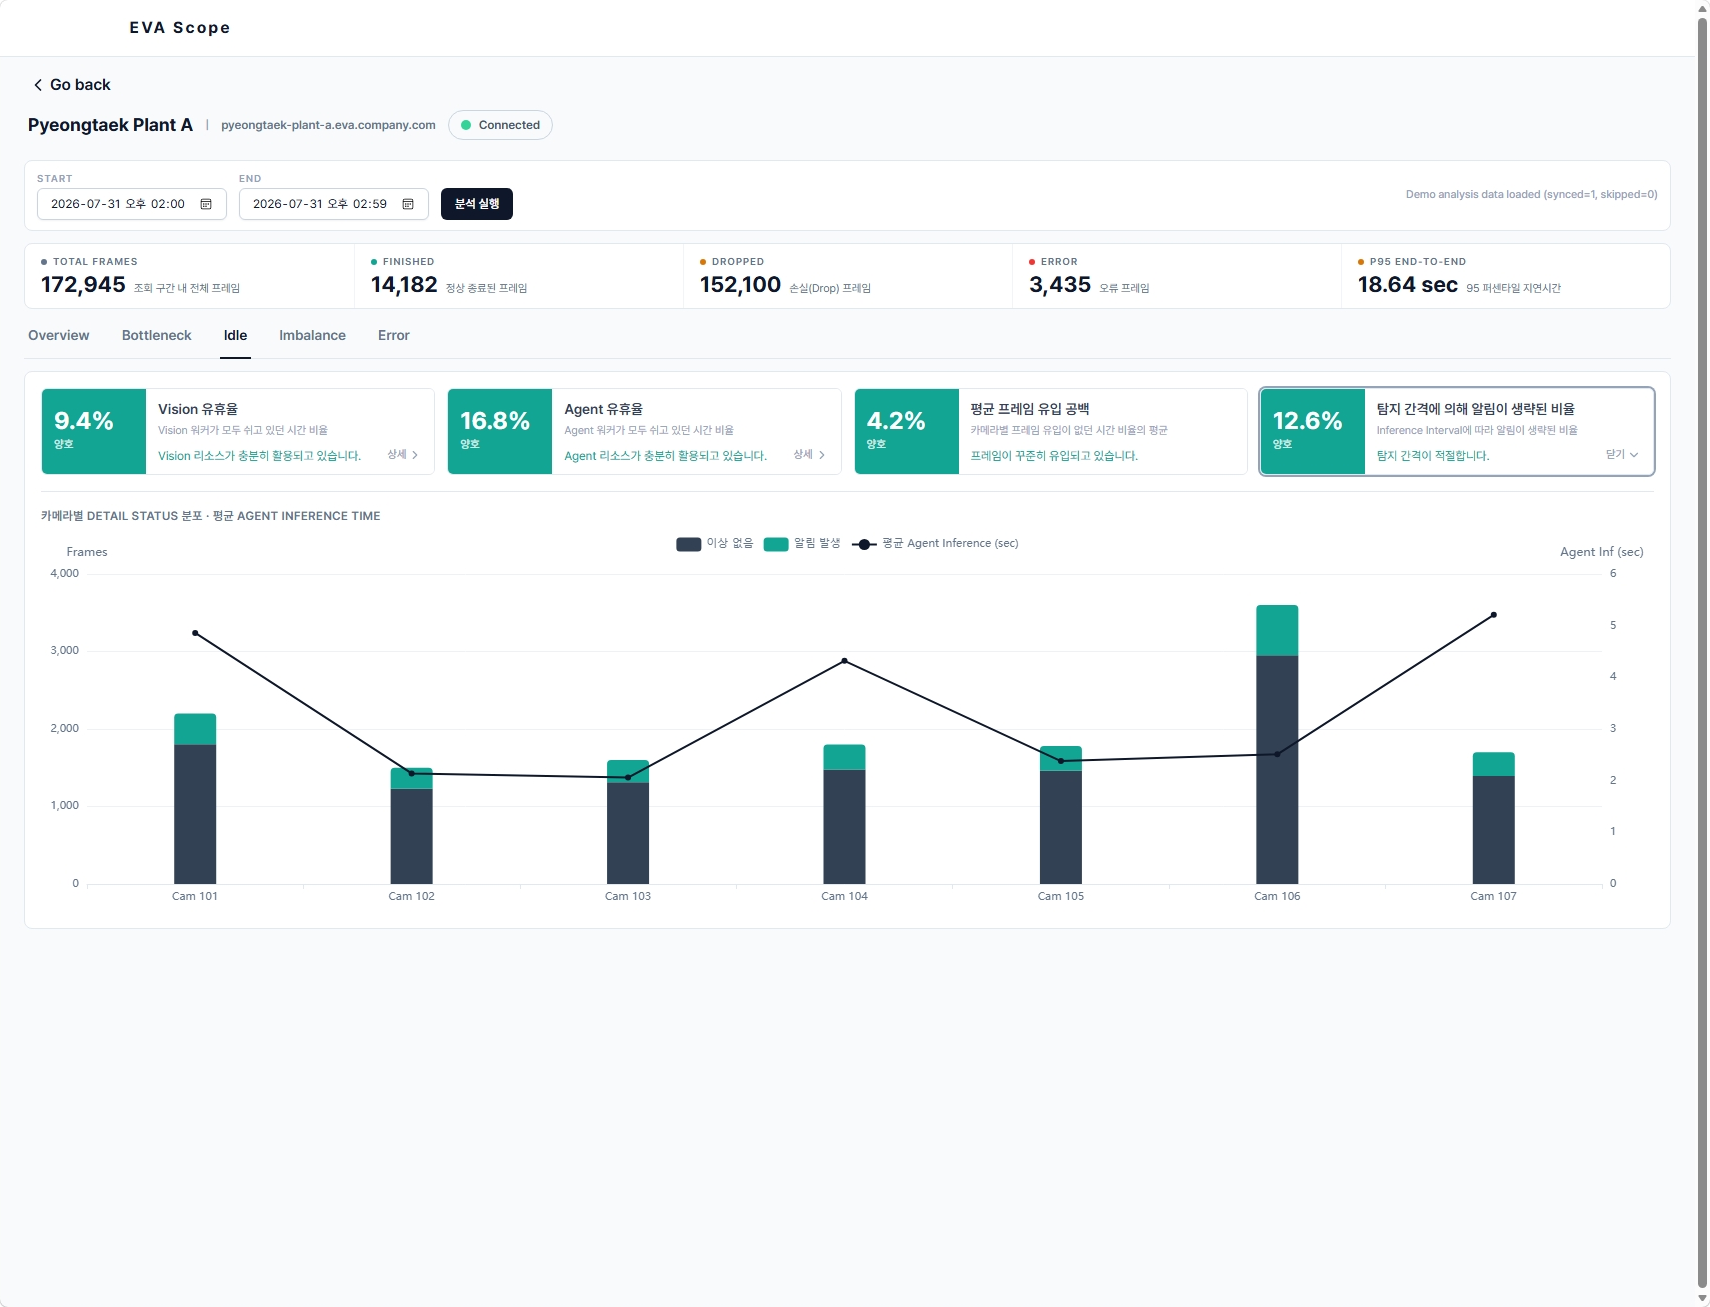
This flow allows operators to go beyond checking an Alert and determine which stages and resources should be adjusted first to improve processing efficiency. EVA Scope does not decide the improvement plan on its own. Instead, it provides the evidence needed to consider follow-up actions such as reallocating resources, adjusting Queue policies, reviewing camera-specific processing policies, and improving the inference environment.
3. Why Observability Is Needed in Large-Scale CCTV Operations
In a small-scale environment, checking a few cameras and a single EVA App can provide a reasonable understanding of the system status.
As the operation grows, however, the following problems emerge:
- The status of dozens of EVA Apps must be checked individually.
- Frame-processing status is distributed across hundreds or thousands of cameras.
- The final Drop result does not reveal where a failure occurred.
- It is difficult to connect the time of a problem to the original frame.
- Users must find the relevant data manually after noticing a problem.
An image-frame processing pipeline is not a simple request-response structure.
A single frame passes through multiple asynchronous stages. Some frames may be Dropped during processing or end in a different state. As a result, alerts visible in the UI alone are not enough to determine whether EVA is operating in an optimal state.
Frame Ingest
    ↓
Frame Queue
    ↓
Vision Inference
    ↓
Agent Queue
    ↓
Agent Inference
    ↓
Finished / Dropped / Error
To determine whether EVA is operating optimally, operators need to know which path each frame took and how much time it spent at each stage.
EVA Scope combines three types of information:
- The final state of the frame
- Timestamps for each processing stage
- Processing context by Connection, camera, and time period
This makes it possible to answer questions beyond simply saying that inefficiency occurred:
- Which EVA App experienced the bottleneck?
- At what time did the load begin to increase?
- Is the bottleneck in Vision, Agent, or the Queue?
- Is the problem concentrated on a particular camera?
- Is the bottleneck still occurring?
- Did processing efficiency actually change after an action was taken?
4. EVA Scope Core Intelligence
EVA Scope Core Intelligence is the core technology layer that collects and aggregates large volumes of frame data and transforms them into signals that can be used for operations.
4.1 Overall Architecture
EVA Scope collects Image Frame Journey data from EVA Apps, stores it in a database, and analyzes it through a dashboard. In EVA Scope, a Journey refers to the processing path of an image frame from Ingest through Queue, Vision, and Agent to its final state.
Dozens of EVA Apps
        ↓
Hundreds to thousands of Cameras
        ↓
EVA App stats-dump (JSONL)
        ↓
FastAPI Backend
        ↓
Streaming Parser
        ↓
Hourly Rollup Accumulator
        ↓
ClickHouse
    ├─ Raw Frame Data
    ├─ Hourly Health Rollup
    ├─ Ingestion Ledger
    └─ Alerts
        ↓
Next.js Dashboard
    ├─ Connections List
    ├─ Alert History
    └─ Detailed Analysis
The current design considers dump files of approximately 50 MB per Connection per hour and a maximum of 100 Connections. At this scale, it is important to separate operational monitoring data from detailed analysis data instead of querying all Raw data every time.
4.2 Raw and Rollup: Data Collection and Storage Strategy at Scale
When all Raw frame data is stored and queried continuously in a large-scale environment, storage requirements and query costs increase rapidly. EVA Scope processes data as a stream and separates Raw data from Rollup data during collection. With the rollup_only policy, the stream is consumed to create hourly aggregations, while Raw frames are not stored. With the full policy, the same stream is used for both Rollup aggregation and Raw batch inserts.
Streaming-Based Data Processing
EVA App statistics are provided in JSONL format. EVA Scope reads the dump line by line and aggregates only the required information instead of storing the entire dump in the database or loading it into memory.
- Frame counts by status
- Frame counts and Drop counts by camera
- End-to-End latency
- Vision and Agent inference time
- Queue waiting ratio
- Actual time spent at each processing stage
This approach prevents memory usage from growing in proportion to the total size of the dump file.
Rollup Data
Rollup is operational data aggregated by Connection and time bucket. It provides only the information needed for operations, processed from the data collected through streaming.
- Total frame count
- Finished, Filtered, Dropped, and Error counts
- End-to-End P50/P95 latency
- Frame and Drop counts by camera
- Bottleneck, Idle, and Imbalance indexes
- Risk Score
Connections List and Alert detection use Rollup data. This allows operators to quickly check the overall operational status without scanning thousands of cameras at the Raw-data level every time.
Raw Data
Raw data is used for detailed analysis of individual frames. EVA Scope does not collect all Raw data; it collects and stores Raw data only for the Connection and time period that an operator wants to analyze.
- Inspecting error frames from a specific camera
- Tracing the processing path of an individual frame
- Checking Vision and Agent processing time
- Detailed analysis of a specific time period
EVA Scope also provides Connection-level storage policies.
| Policy | Description |
|---|---|
rollup_only | Default policy. Stores aggregated data only |
full | Stores Raw data continuously |
Under the default policy, operations are centered on Rollup data. When an operator requests detailed analysis, Raw data for the required time period can be collected again. In other words, EVA Scope does not store all data in the same way. Operational data is aggregated lightly for fast queries, while data needed for root-cause analysis is separated so that it can be inspected in detail when needed. With this Rollup policy, EVA Scope maintains monitoring capabilities for all Connections while reducing storage requirements by 99%.
4.3 Key Metrics Design
EVA Scope uses a range of metrics to diagnose operational efficiency and effectiveness in large-scale environments.
| Metric | Meaning |
|---|---|
| Bottleneck Index | Risk of frame loss caused by processing delays and Queue waiting |
| Idle Index | Idle level in the Vision, Agent, and camera-ingestion stages |
| Imbalance Index | Degree to which processing or Drops are concentrated on particular cameras |
| Error Index | Ratio of erroneous frames among all frames |
| Risk Score | Connection-level risk calculated from multiple metrics |
Closing
The real challenge in a large-scale CCTV AI environment is not a lack of infrastructure but the opacity of the AI system’s internal behavior. If operators do not know where bottlenecks occur or which resources are sitting idle among the frames arriving from thousands of cameras, adding GPU servers will not solve the problem. Previously, it was difficult even to identify which EVA among the many running EVAs needed improvement. Even after finding one, analyzing system logs could take tens or hundreds of minutes. EVA Scope dramatically shortens this process by converting it into intuitive signals. By visualizing the entire Journey from image-frame ingestion to the final Agent inference, it enables operators to optimize the configuration and settings of the AI system based on clear data.
Beyond monitoring that simply checks whether “the server is alive,” and beyond an operations system that checks “where a failure occurred,” EVA Scope enables operators to determine what to observe and what to improve so that EVA can operate stably and efficiently within limited system resources.
This is the value that EVA Scope aims to provide in large-scale CCTV AI operations.